
MIRA - Ultrasonic Pulse Echo Imaging

The MIRA concrete tomograph represents a revolutionary approach to concrete ultrasonics. The best way of describing its capabilities is by analogy. It is the construction equivalent of ultrasonic scanning in the medical world. Capable of void detection for flaws as small as 30 mm at 400 mm depth the MIRA can also measure slab thickness, test tile or panel bond, confirm grouting behind panels or in post tension ducts and is the only system that can measure cover in steel fibre reinforced concrete.
The Mira is not one new technology. It is many new technologies seamlessly combined to create a truly revolutionary concrete investigation tool.
There are various features that contribute to why this device is so advanced:
The Ultrasonic Transducers are only 2mm diameter
This is made possible through the use of side scanning shear wave emission technology developed by ACSYS’s. Conventional ultrasonic equipment would typically use 50mm diameter transducers to produce compression waves.
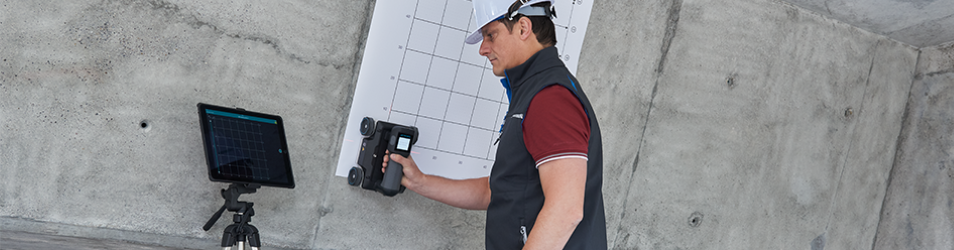
The Ultrasonic Probes require no coupling gel
Dry point contact transducers mean that instead of having to use coupling gel to ensure the transmission of waves into the concrete as in standard ultrasonics. The probe can be moved from position to position with next to no surface preparation.
The use of a multiple array of probes in one head
Only possible because of the small ACSYS probes specially designed spring mounting to ensure uniform contact. This enables around 100 pulse echo ultrasonic results to be obtained in under 2 seconds with each scan. Hence readings are taken at close (30mm) spacing. Typically ultrasonic measurements in concrete are taken one at a time at 500mm centres in order to make processing manageable.
The software builds 3D sectional images of the concretes internal geometry
These images can be played as if the viewer were travelling through the concrete, displayed as any section through the concrete or 3D scans can be used to show progressive sections through the concrete.
The software builds 3D sectional images of the concretes internal geometry
This provides sufficient energy that a pulse echo mode can be used. Ultrasonics in concrete typically uses direct transmissions which requires access to both faces and is limited to one time consuming reading at a time.
 Data is collected and undergoes initial processing using an on board computer
Data collected is previewed on the internal screen and can be automatically combined to investigate large areas with on-board processing software. The processed signals from each scan can be downloaded to a desktop computer for further processing using the new and improved 3D imaging software available. This makes the measuring head light and easy to use, and testing can be undertaken by one person. Conventional ultrasonic testing require two people.
The software automatically combines multiple scans
The image produced is actually made up of multiple scans. The probe is stepped over the surface of the element in a grid. The software then interpolates the scans into a full 3D image. The size and spacing for the grid is user specified and the more overlapping the higher the quality of the resulting image.
Pulse Echo Ultrasonics - How it Works in Practice
 Sixty six ultrasonic readings are taken and analysed by the software to determine how many signals are reflected by different points in the concrete. The computer builds up a coloured image of the concrete interior using SAFT processing. The different colours represent the intensity of the reflected waves. Sources of reflection can be different materials such as air voids (cracks, honeycombing etc.) within the concrete. The scale is from blue->green->yellow -> red, dependent on the amplitude of the reflected waves, with black representing no reflection. Any included material interface may reflect a signal but certain interfaces reflect more strongly. Air concrete interfaces will reflect virtually the entire wave energy.
The image below indicates the SAFT reconstruction from a single point reflector within the concrete. To the left is the probe set-up over the reflector and tot the right is the image produced, showing a representation of the point reflector. The SAFT image is generally called a B-Scan.

Visual Presentation of Ultrasonic Results
Results can be visualised on the screen of the MIRA. The two images below are screenshots of data collection on the MIRA. To the right of both screen shots is a B-Scan. To the left of the left screenshot; an amplitude graph is shown as well as the position for the cross hairs and wave speed calculated. This mode of operation can either be used to adjust setting or for simple diagnostics. For example a slab thickness could be easily determined. The right hand screen shot is from a grid collection mode. This is the mode that is used to collect data for full 3D images. To the left of the B-Scan we can see a table with the grid spacing setting and a grid indicating the position.


Using the Software
Once on the PC the full imaging can begin. Firstly the data file is transferred using the USB cable. Note that raw B-Scans can be instantly transferred as bitmaps. Once a grid of scans is processed by the software a range of planar and 3D images can be viewed. They can be rendered of as planar images cutting through the concrete element on the X, Y, and Z axis or as a full 3D solid.
Planar Images
Planar images can in some cases be easier to reconcile with the actual concrete structure in question. In the image below we see the 3 types of planar images and how they are orientated compared to the MIRA probe. The B-Scan is as previously discussed, whilst the D-Scan is at right angles to the Probe. The C-Scan is a plan view of the grid area collected. One purpose of these planar images could be to show a slab profile (see D-Scan).
A planar image can either be a slice or gated. A slice is an image at an exact position in any of the axis (ie as shown in the bottom right hand image). Whereas using gates we can compress all of the data from a band into a flat image. For example show the defects between 200 and 300mm in one C-Scan like a map from the surface.

3D Images
3D images are the most intuitive. The concrete element scanned is shown as a solid than can be rotated around any axis. To make the interior of the concrete easier to see (i.e. to highlight the defects) the low amplitude areas a made transparent (as in the right hand image below). The higher amplitude reflections are left. The right hand image below shows a combination image of planar scans shown in position on a 3D solid.
Applications
Honeycombing
Even light honey combing appears to reflect a wave and it does not seem to require great severity to give a “red” area. This is probably useful as from an engineering perspective even minor voiding causes significant reduction in concrete strength and durability. The advantage of the MIRA is the concrete can be viewed in a continuum in all three dimensions. It is the extent and continuity of voiding that is most important to the engineer. If voiding exists throughout the wall it may cause leakage issues. A large area of minor voids close to rebar depth could be a durability issue and voiding in a critical area, e.g. corbel intersection with main element, may weaken an otherwise sound structure.
Poorly Grouted Prestressing Ducts
The grouting systems used in Australia until around 2007 were poor. The systems used were the same systems that led to the banning of post-tensioning in bridges in the UK. In Australia less concern was recommended as, unlike Europe, Japan and North America, Australia did not use de-icing salts. The de-icing salts were considered to be the main source of pre-stress corrosion in poorly grouted ducts. The grouting systems used in Australia now follow the improved systems introduced in North America and Europe and poorly grouted ducts should not be an issue for new structures. However there is a potential for post tension cable failure in older post-tensioned bridges, particularly in areas where marine spray could lead to ingress of water with high chloride content. Where failure risks are high the Mira, possibly in conjunction with Impact Echo and Boroscopes, would be a useful system for investigating the condition of post-tensioning cables and to confirm post tension repairs.
Construction Joints
The perfect construction joint will transmit a signal in a similar fashion to uninterrupted concrete while poor joints will reflect a large portion of the wave energy. Although the Mira can be used to get an indication of the joints performance caution is needed, particularly where the materials on either side of the joint are different as wave energy can be reflected due to this difference. The Mira results can be treated as indicating areas for more detailed testing.
Conduits
Empty conduits provide an interface that will strongly reflect waves. The sensitivity of the Mira at showing voids can be seen from tests where conduits as thin as 25mm are visible.
Thickness
The air concrete interface of walls and suspended slabs give a very strong wave reflection as does the interface of the internal wall of a pipe, even when running full. The picture to the right shows an image of a pipe running full and the pipe thickness around a half circumference can be seen in the D-scan. Although the shear wave may have sufficient energy to reflect off the opposite face up to 2m away 0.5m is more typically the limit, and even then if there are defects in the concrete the rear surface may not be seen. The thickness of a slab on grade will generally be detected as the concrete will be a very different material to the material it is sitting on. However, blinding concrete may give an overestimation of thickness where the interface between it and the structural concrete cannot be seen.
Clearly very careful thought to what the results mean in engineering terms is required bearing in mind that defects identified would not have been recorded using previous technology.
Form supplied
The full system contains:
- А1040 MIRA-tomograph ultrasonic unit
- Detachable battery
- Charging unit
- USB connection cable
- Transportation Case
Sold separately the Ideal 3D software requires a high specification laptop with an NVidia graphics card that supports CUDA processing.